FREE
SOFTWARE FOR THE
3D AND 2D MORPHOLOGICAL ANALYSIS |
The software may be used freely provided it is acknowledged.
Any publication arising from use of the morph2D or morph3D program should
contain the following references:
-
M. Fialkowski, A. Aksimentiev, and R Holyst Scaling
of the Euler characteristic, surface area, and curvatures in the phase
separating or ordering systems, Phys. Rev. Lett. 86, 240 (2001)
(3D and 2D analysis)
-
A. Aksimentiev, M. Fialkowski, and R. Holyst Morphology
of surfaces in mesoscopic polymers, surfactants, electrons or reaction-diffusion
systems: methods, simulations and measurements, Adv. Chem. Phys. 121,
141
(2002) (2D and 3D analysis)
-
M. Fialkowski and R. Holyst Morphology from the
maximum entropy principle: Domains in the phase ordering system and crack
pattern in a broken glass, Phys. Rev. E 65, art. no. 057105
(2002) (2D analysis)
Numerical methods used in the programs morph2D
and morph3D are also briefly described
in the manual. This software comes under no guarantees.
If you have comments or find any bugs please report them to me at fialkows@ichf.edu.pl
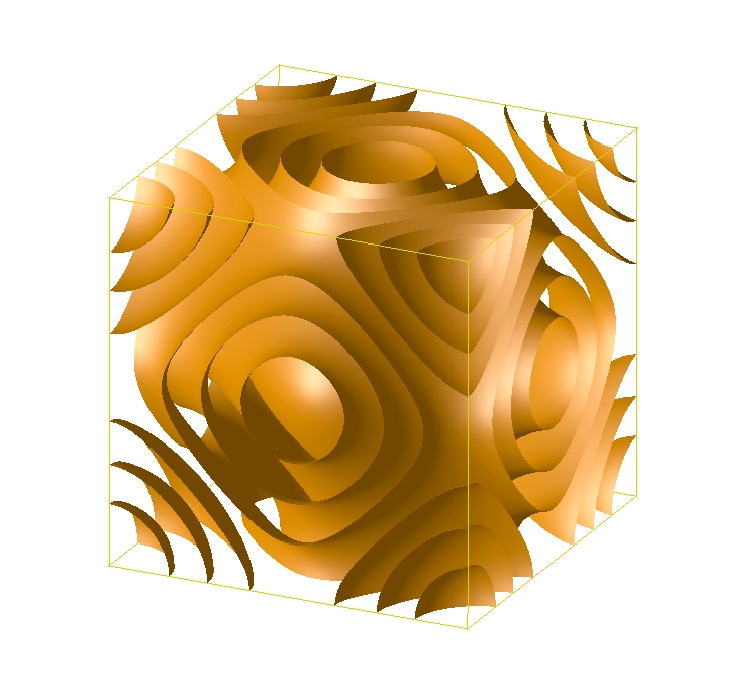
3D MORPHOLOGICAL ANALYSIS
DESCRIPTION:
The input is 3D scalar field f represented
by a set of discrete values After reading input data:
-
The program determines all closed surfaces separating f<f_0
and f>f_0, where f_0 is input threshold value.
-
For each surface, the area, Euler characteristic, and the
integral of mean curvature over the surface area is calculated.
-
All the vertices v_i are scanned; The mean H_i and Gaussian
K_i curvatures and the area S_i associated with every single vertex are
collected in an output file. This file can be used to make a histogram
of the curvatures.
The program is fairly fast but uses a lot of memory. For
example, for a simulation box as big as 30^3 about 40Mb of RAM is
required.
COMPILING:
The program is written in ANSI C.
The whole code is in one (gnuzipped) piece called
If you are using the GNU C compiler, to make executable simply type:
gcc
morph3D.c
-lm -o morph3D
SYNTAX:
The exec file, morph3D , is called with three
arguments
morph3D
Nthreshold
input_file
INPUT:
-
N is the linear size of the simulation box
-
threshold is the threshold value f_0 of the
field f
-
input_file is the name of the input file
The input file consists of one column obtained in the following
way:
Assume that the scalar field f
is
sampled on the 3D matrix f[i][j][k]
with the periodic boundary
conditions:
f[0][j][k]=f[N-1][j][k]
f[i][0][k]=f[i][N-1][k]
f[i][j][0]=f[i][j][N-1]
The input file is then produced in the loop:
for(i=0;i<N-1;i++)
for(j=0;j<N-1;j++)
for(k=0;k<N-1;k++)
fprintf(input_file,"%lf\n",f[i][j][k]);
PLEASE NOTE: In the above loops the indices i,
j, and k run over N-1 points and the second (redundant)
boundary is skipped.
OUTPUT:
As the output the program gives the number of separate surfaces
(integer). For each surface the area (double) Euler characteristic (integer),
and integral of the mean curvature over the area of the surface (double)
is given. All the results (lengths, curvatures, and areas) are calculated
for the box size equal to unity (regardless of the grid size N).
In the working directory the output file input_file.his
is created. It is composed of three columns, which are H_i, K_i, and S_i.
H_i, and K_i are, respectively, the mean and Gaussian curvatures, and the
area (i.e. weight) associated with the i-th vertex.
The output file may be quite big since it contains the
number of lines equal to the number of all vertices, which is usually of
the order 10^4 - 10^5. So, if you do not want to make the histograms
you can simply cancel the procedure MakeHistogram() (line 214 in the source
file morph3D.c).
SAMPLE RUNS:
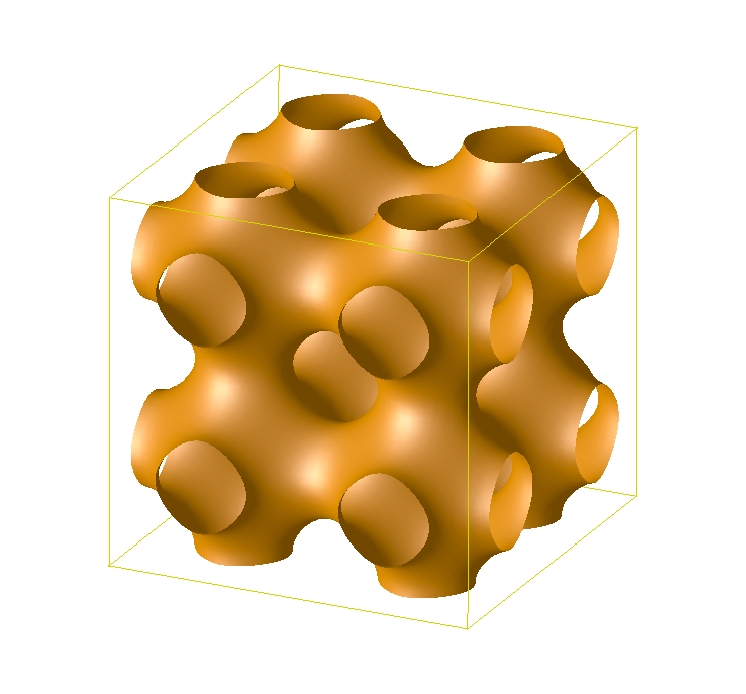
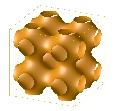 grid size N=50 threshold=0.0 input
file: pb.dat (0.45Mb)
grid size N=50 threshold=0.0 input
file: pb.dat (0.45Mb)
NUMBER OF SURFACES: 1
#
AREA EULER CHAR. INTEGRAL OF H
----------------------------------
1 4.713455
-32
0.000982
output file: pb.dat.his (0.39Mb)
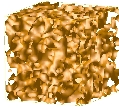
 grid size N=50 threshold=0.0 input
file: pm.dat (0.52Mb)
grid size N=50 threshold=0.0 input
file: pm.dat (0.52Mb)
NUMBER OF SURFACES: 9
#
AREA EULER CHAR. INTEGRAL OF H
----------------------------------
1 0.324751
2
-2.022234
2 0.812731
2
3.207685
3 1.441901
2
-4.335119
4 2.196970
-4
2.315473
5 2.359155
-4
-0.000003
6 2.196973
-4
-2.315444
7 1.441906
2
4.335127
8 0.812735
2
-3.207712
9 0.324754
2
2.022261
output file: pm.dat.his (1.1Mb)
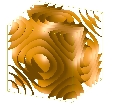
 grid size N=61 threshold=0.0 input
file: ma.dat (0.80Mb)
grid size N=61 threshold=0.0 input
file: ma.dat (0.80Mb)
NUMBER OF SURFACES: 2
#
AREA EULER CHAR. INTEGRAL OF H
----------------------------------
1 14.979642
-594
14.545141
2 0.009179
2
-0.356581
output file: ma.dat.his (2.84Mb)
2D MORPHOLOGICAL ANALYSIS
DESCRIPTION:
The input is 2D scalar field f represented
by a set of discrete values After reading input data:
-
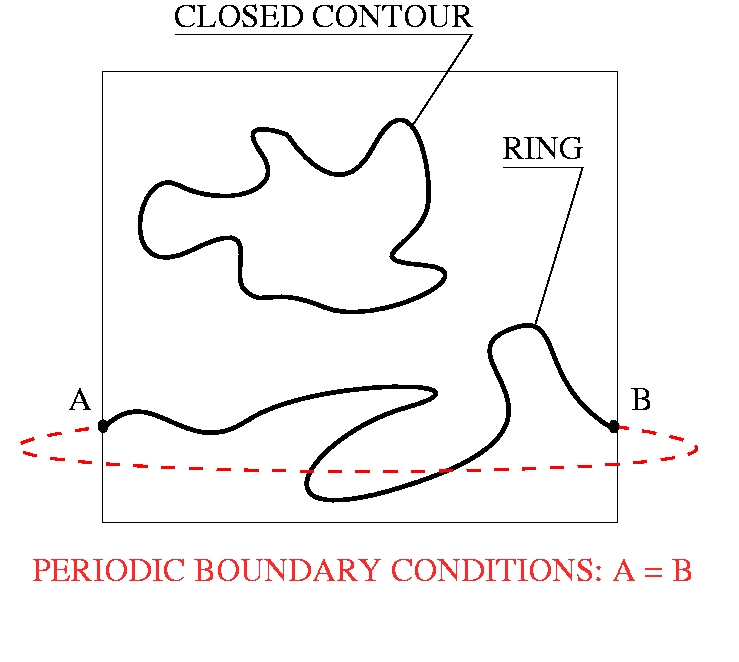
The program determines all closed contours and rings (see
Fig.
1 for the explanation) separating f<f_0 and f>f_0, where
f_0 is input threshold value.
-
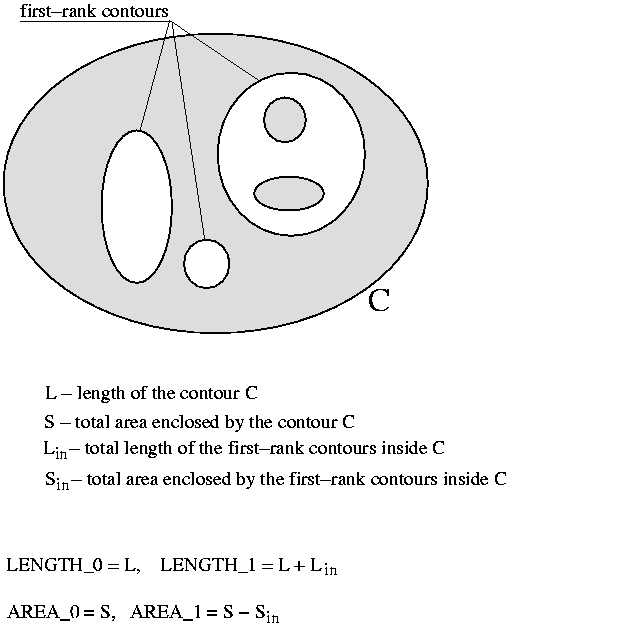
For each closed contour the program determines (i) the length
of the contour (LENGTH_0), the area enclosed by the contour (AREA_0), the
total length of the contour and the first-rank contours inside it (LENGTH_1),
the area enclosed by the contour minus the total area enclosed by the first-rank
contours inside it (AREA_1), the average radius of the contour (RADIUS),
and the type of the contour (TYPE). The definition of the the lengths and
areas is explained in Fig. 2.
The average radius is calculated as the average distance between the points
(vertices) on the contour and the geometrical center of mass of the contour.
If the contour encloses f>f_0 in the sea of f<f_0 then
it is marked with "-", otherwise it is marked with "+".
-
For each ring the length (LENGTH) is calculated
-
All the vertices v_i are scanned; The curvature k associated
with every single vertex are collected in an output file. This file can
be used to make a histogram of the curvatures.
COMPILING:
The program is written in ANSI C.
The whole code is in one (gnuzipped) piece called
If you are using the GNU C compiler, to make executable simply type:
gcc
morph2D.c
-lm -o morph2D
SYNTAX:
The exec file, morph2D, is called with three
arguments
morph2D
Nthreshold
input_file
INPUT:
N is the linear size of the simulation box
threshold is the threshold value f_0 of the
field f
input_file is the name of the input file
The input file consists of one column obtained in the following
way:
Assume that the scalar field f
is
sampled on the 2D matrix f[i][j]
with the periodic boundary
conditions:
f[0][j]=f[N-1][j]
f[i][0]=f[i][N-1]
The input file is then produced in the loop:
for(i=0;i<N-1;i++)
for(j=0;j<N-1;j++)
fprintf(input_file,"%lf\n",f[i][j]);
PLEASE NOTE: In the above loops the indices i and
j
run
over N-1 points and the second (redundant) boundary is skipped.
OUTPUT:
As the output the program gives the number of closed contours
of either types (integer) and the number of rings. For each closed ring
the length LENGTH_0 (double), LENGTH_1 (double), AREA_0 (double), AREA_1
(double), RADIUS (double), TYPE (integer) is given. All the results (lengths
and area) are calculated for the box size equal to unity (regardless of
the grid size N).
In the working directory the output file input_file.his
is created. It is composed of three columns, which are k_i, l_i ,
and TYPE. They are, respectively, the curvature, the length of interface
(i.e. weight) associated with the i-th vertex., and the type
of the contour (rings are marked with "0"). If you do not want to
make the histogram you can simply cancel the procedure MakeHistogram()
(line 155 in the source file morph2D.c).
SAMPLE RUNS:
 grid size N=500 threshold=0.0 input
file: cir.dat (6.5 Kb)
grid size N=500 threshold=0.0 input
file: cir.dat (6.5 Kb)
NUMBER CLOSED CONTOURS: 1 (+), 2 (-), NUMBER OF RINGS:
0
CLOSED CONTOURS:
# LENGTH_0 LENGTH_1 AREA_0
AREA_1 RADIUS TYPE
---------------------------------------------------------
1 2.911023
4.360292 0.498763
0.374931 0.397662 -1
2 1.449269
2.342087 0.123832
0.076647 0.198153 1
3 0.892818
0.892818 0.047185
0.047185 0.122323 -1
output file: cir.dat.his
(7.1 Kb)
 grid size N=500 threshold=0.0 input
file: dom.dat (212Kb)
grid size N=500 threshold=0.0 input
file: dom.dat (212Kb)
NUMBER CLOSED CONTOURS: 4 (+), 2 (-), NUMBER OF RINGS:
2
CLOSED CONTOURS:
# LENGTH_0 LENGTH_1 AREA_0
AREA_1 RADIUS TYPE
---------------------------------------------------------
1 1.572575
1.744433 0.110333
0.108187 0.186409 1
2 0.171858
0.171858 0.002146
0.002146 0.026949 -1
3 0.781716
0.781716 0.024446
0.024446 0.088450 -1
4 0.264802
0 .264802 0.005144
0.005144 0.042030 1
5 0.155437
0.155437 0.001816
0.001816 0.023973 1
6 0.348709
0.348709 0.008515
0.008515 0.055131 1
RINGS:
# LENGTH
---------
1 1.114251
2 1.395887
output file: dom.dat.his
(54Kb)
 grid size N=50 threshold=0.0 input
file: pb.dat (0.45Mb)
grid size N=50 threshold=0.0 input
file: pb.dat (0.45Mb)
 grid size N=50 threshold=0.0 input
file: pm.dat (0.52Mb)
grid size N=50 threshold=0.0 input
file: pm.dat (0.52Mb)
 grid size N=61 threshold=0.0 input
file: ma.dat (0.80Mb)
grid size N=61 threshold=0.0 input
file: ma.dat (0.80Mb)

